There are a couple of reasons for this report, one is that folks who have an enclosure would like to verify that it is indeed shielding and operating correctly and another is simple curiosity on how we measure the enclosures here at the factory. This paper should be read along with watching the video below:
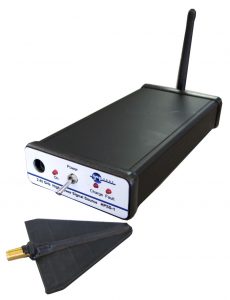
The signal source and antenna set is the JRE Test HPSS-1 Measurement Set, which includes the signal source, dipole antenna, charger adapter and Yagi antenna.
 Simply expressed, we use a small transmitter and measure its signal both inside and outside the enclosure. We know what signal level the transmitter is radiating while it is, "in the clear" and again measure the signal level when it is, "in the box." The difference between the two measurements is the isolation of the enclosure. A small directional Yagi antenna is used along with a suitable RF spectrum analyzer capable of operation to at least 2.5 GHz. The spectrum analyzer serves simply as a receiver producing a visual display of the transmitter's RF signal and the Yagi antenna a handy probe to "sniff" around the enclosure looking for any signal leaks. Let's take a look at how we calibrate this system and how to do the actual test.
The transmitter signal source is a synthesized RF generator operating at 2.45 GHz, this frequency being a good match for antenna size, RF power generation and ease of measurement with lower cost spectrum analyzers. A synthesized source is needed since we will want to adjust our spectrum analyzer for maximum sensitivity and that entails narrow bandwidths, and if the source was free-running, it would drift outside of the analyzer's bandwidth. Since we are attempting to measure isolation greater than 100 dB, we need a high power source - on the order of 250-500 mW! This source should be free standing, requiring no external power since we do not want to add complexity to the tests by having to breach the isolation barrier by a power cable.
While a simple 2.45 GHz receiver could be used to measure the source's signal, receivers in the 2.5 GHz range are not all that common and the visual display of a spectrum analyzer makes measuring very easy and intuitive.
Test set-up:
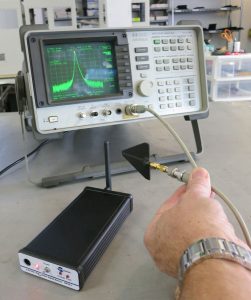 We first need to establish a reference level baseline from which the isolation will be measured from. Think of our initial signal measurement as the high water mark on ameasuring cup, that's as high as it gets, everything is down from there. The signal source is switched on, and the spectrum analyzer is tuned to its signal at 2.45 GHz. You will see its signal pip on the analyzer's screen. Hold the Yagi antenna close to the signal source's antenna and adjust the analyzer's reference level so the pip touches the top of the screen. The top of the screen is the high level water mark, as you move the antenna away, you will see the signal drop off, just like you would expect (just like driving further away from the local radio station or moving farther away from the street light. Power drops off as we move away!) You can get a feel for how much an RF signal fades with distance by playing around with it, at 2.45 GHz, you will see the path loss being about 20-30 dB just by moving the antenna meter away! (Hum... there's the reason some manufactures are afraid to spec their boxes at less than a meter distant!)
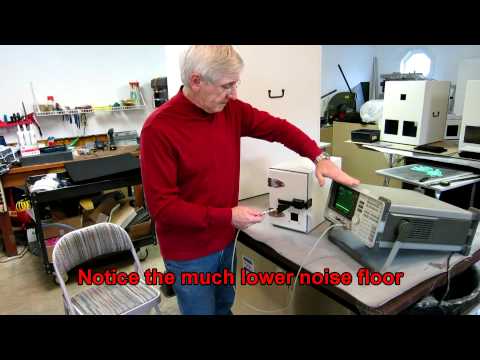
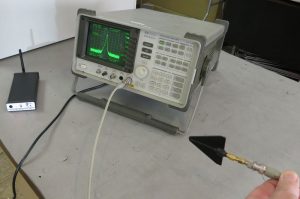 Now that we have the analyzer calibrated to show top of the screen with the source on, place it inside the enclosure and slowly close the door. Notice the signal getting weaker and weaker until it is almost impossible to see on your spectrum analyzer screen, the 'pip' become buried in the grassy noise floor.
 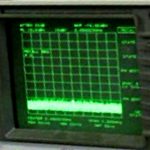 On most analyzers, you should be able to see down 80-90 dB on the screen (8 to 9 divisions and each division being 10 dB). So, right off the get-go, based upon the above, we can see that the enclosure has a minimum of 80 to 90 dB of isolation and this is with the antenna mere centimeters from the enclosure - factor in the 20 dB minimum path loss of 2.45 GHz at a meter distant and you end up with an isolation figure of 100 to 110 dB. This is a fast, easy reliable test of the shielding. It's not a bad idea to perform this test periodically to ensure your enclosure is operating correctly, especially after reconfiguring or shipping.
Increasing the spectrum analyzer’s sensitivity:
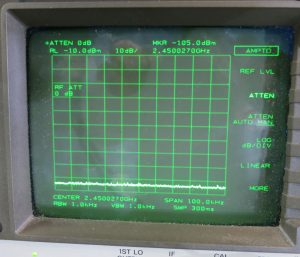 To really dig deeper and see the signal, we have to play with the analyzer settings to narrow its bandwidth and change the input attenuator, thus increasing its sensitivity. By default, all analyzers insert a 10 to 20 dB attenuator on the RF signal input. This is to protect the expensive front-end mixer component from overload and damage - an expensive repair. It is better to blow out the attenuator rather than the mixer! We can increase the analyzer's sensitivity by switching out this attenuator. Generally, this function is under the "Amplitude" selection and labeled "Input Attenuator", change it to 0 dB and you will be prompted by a warning to be careful about what you are applying to the analyzer. As long as you are using our test signal source and our Yagi antenna, you have no worries! To narrow the bandwidth, select a "Span" of 100 KHz, this will typically also preset the analyzer to a Resolution and Video bandwidth of 1 KHz, the sweep speed across the screen may be slower, but you will be able to see all the way down to -110dBm. Note that when you change the analyzer's settings, you will be "changing the rules after the game has started" - we set out reference "high water mark" earlier at the top of the screen representing the maximum signal. Now, we changed it so the top of the screen is 20 dB more sensitive, so any reading we get will be 20 dB better than in the first case of analyzer settings. In this example, you can see that initially we had the "high water mark" pip at the top of the screen and the Reference Level was +10 dBm. After the changes, we see the Reference Level is now -10 dBm, so... whatever we read on the screen now is 20 dB different. For example, if we initially saw the pip way down at 8 divisions from the top (80 dB) after we change the analyzer setting we see the pip 6 divisions down, this is still the same measured signal (add in the 20 dB and its still 80 dB down) but we can now see much further down into what used to be the "grassy" noise. In most cases we can read easily a 'pip' down at -110dBm.
Final thoughts:
Measuring a weak signal like this is not difficult and quite enlightening. Using the Yagi makes sniffing easy and by holding the Yagi close to the enclosure we can see the very tiny signal, something we can’t do at a meter away unless we have extremely sensitive measuring equipment and access to an anechoic chamber to perform our test. It is far easier and every bit as reliable to simply add in a conservative 20 dB for the extra path loss at 1 meter distance.